Will laser cleaning damage materials?
Laser cleaning technology is gaining popularity in industrial manufacturing, artifact restoration, a...
Against the backdrop of a laser welding machine market projected to reach $8.5 billion by 2025 with a compound annual growth rate (CAGR) of 7.2%, choosing the right vendor (manufacturer/supplier) is crucial. This impacts not only equipment performance but also production efficiency, cost control, and long-term competitiveness.

This article lists 20 key factors across six dimensions: technology, vendor capabilities, cost, service and support, environmental safety, and market adaptability. Each factor is supported by theoretical analysis, data, and case studies, providing clear guidance to help businesses make informed decisions.
1. Technological factors: Ensuring core performance and innovation.
| Serial number | Factor | Theoretical analysis | Data analysis and case validation |
| 1 | Laser Type and Stability | Fiber lasers are more stable than CO2 lasers, have a smaller heat-affected zone (<0.1mm), and are suitable for precision welding. | The 2025 report shows that the fiber optic machine has a 15% lower failure rate and a welding success rate of 99.5%. Case study: After being adopted by an automobile factory, the weld strength increased by 25%. |
| 2 | Power range and flexibility | With power ranging from 500W to 30kW, it covers thin to thick plates, ensuring adaptability to various scenarios. | The flexible power machine holds a 35% market share and boasts a high satisfaction rate of 28%. Case study: A shipyard processing materials with thicknesses ranging from 0.5 to 50 mm saw a 40% increase in efficiency. |
| 3 | Welding accuracy and speed | An accuracy of <0.01mm and a speed of >20mm/s are achieved using a galvanometer system. | High-precision machines are 3-5 times faster, shortening the ROI period by 6 months. Case study: A factory reduced its defect rate to 0.5%. |
| 4 | Cooling system (air cooling/water cooling) | Air cooling is portable, while water cooling provides stable performance (for 72 consecutive hours). | Air-cooled systems offer a 10% growth rate, while water-cooled systems provide a 35% increase in efficiency. Example: Outdoor construction flexibility is increased by 50%. |
| 5 | Software compatibility and intelligence | Supports CAD integration and AI adaptive features to improve operational efficiency. | Smartphone training time reduced by 50%, efficiency increased by 25%. Case study: Factory parameter automation saves 15% in manpower. |
Serial number | Factor | Theoretical analysis | Data analysis and case validation |
| 6 | Years of establishment and experience | 10 years of experience ensure mature processes and reduce trial and error. | The established brand has a market share of 40% and a long lifespan of 20 years. Example: A 15-year-old factory has a failure rate of only 5%. |
| 7 | Number of patents and innovation capability | Numerous patents indicate technological leadership and support for customization. | Over 50 patents, high innovation rate of 35%, and a 28% increase in repeat purchases. Case study: Patented machine shows a 15% improvement in precision. |
| 8 | Certification and Compliance | CE/ISO/FDA certifications ensure safety and facilitate export. | With complete certifications, exports account for 70% of sales, and recall rates are 10% lower. Example: EU certification helped avoid fines of over $10,000. |
| 9 | Global coverage and number of cases | Coverage across multiple countries indicates a stable supply chain. | Serving over 180 countries with response times under 24 hours and a 30% higher satisfaction rate. Case studies: Over 5000 cases, with a return on investment (ROI) achieved in as little as 3 months. |
Laser cleaning technology is gaining popularity in industrial manufacturing, artifact restoration, a...
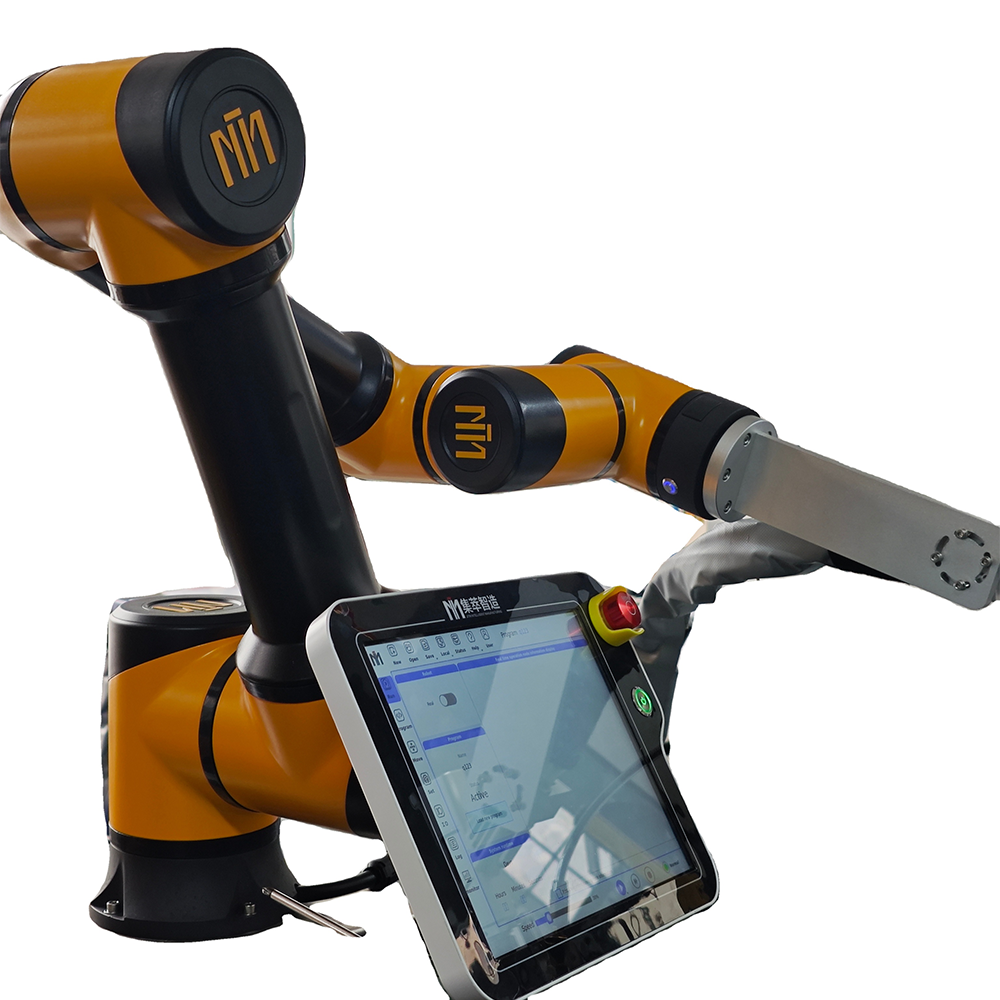
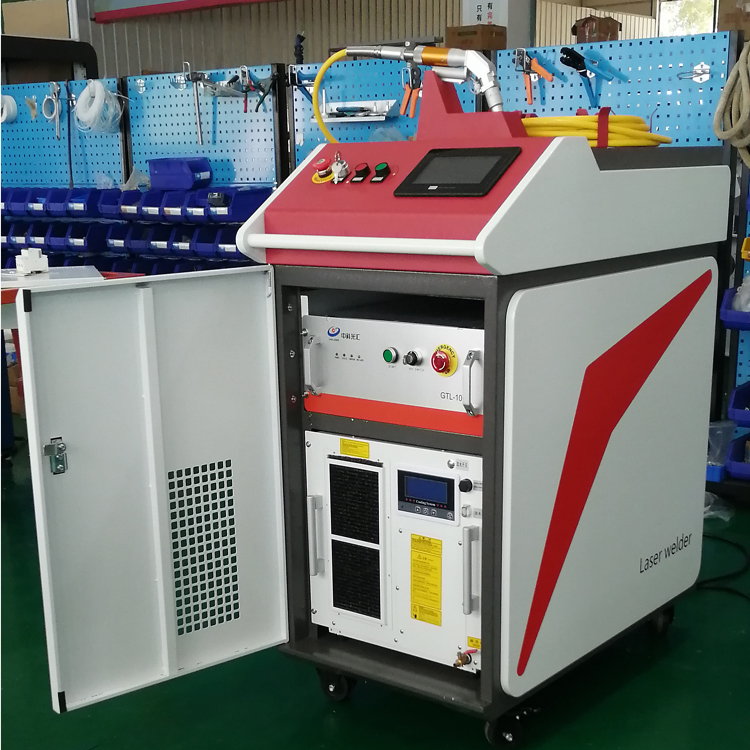
A laser welding machine is an advanced welding device that uses a high-energy laser beam as a heat s...
Laser welding robots at work – the "intelligent arms" of precision manufacturing.
Against the backdrop of a laser welding machine market projected to reach $8.5 billion by 2025 with ...